Precision Strobe Tuner
Operation Manual
Vers 1.5
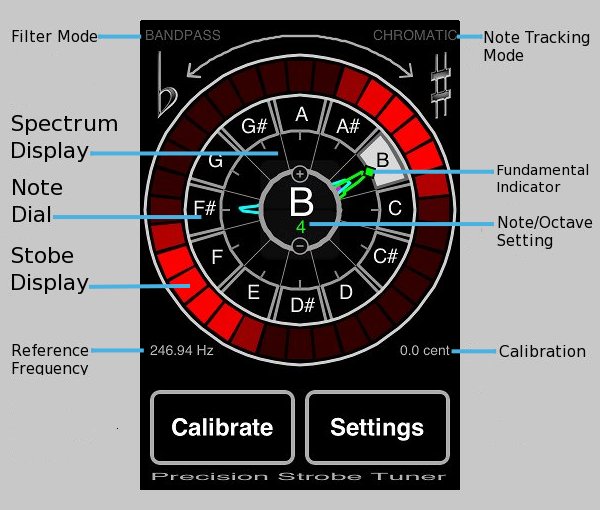
Figure 1
1.0 Quick Start
Apply an Input Tone through either the internal microphone or mic/headphone jack. Tune the Fundamental Peak resulting in the Spectrum Display to center the Target Note highlighted on the Note Dial. The Fundamental Indicator Tic Mark along the Note Dial shows the Fundamental of the Input Tone.
As the Input approaches the Target Note, a Two Group pattern will appear in the Strobe Display, rotating counter-clockwise if the Input is Flat, and clockwise if it is Sharp. When the rotation is stopped, the Input is synchronized with the Reference Pitch of the Target Note, and is perfectly in tune.
The Target Note can be selected manually by tapping the Note Dial. The Octave is adjusted by tapping the + and - circles on the Note/Octave Setting ring.
The Pitch of the A guitar string is 110 Hertz, Note Setting A3.
2.0 Spectrum Display
The Spectrum Display shows the entire Input spectrum wrapped around the Dial, once per Octave, with each Octave shown in a separate color. All of partials of the Input show as peaks in the Spectrum Display pointing towards the corresponding Notes on the Note Dial, like the hands of a clock. Use the Spectrum Display for coarse adjustment by tuning the Fundamental towards the center of the Target Note. When the Input approaches within several Hertz of the Target Note, rotation will become visible in the Strobe Display. Use the Strobe Display for final tuning.
Figure 1 shows the Spectrum Display for a Guitar B string, B4. Note that the Octave 4 Indicator of the Note/Octave Setting in the center shows as Green, the same color as Octave 4 in the Spectrum Display. In the Spectrum Display the Fundamental shows as the large Green peak (Octave 4) pointing toward B in the Note Dial. The Second Partial at twice the frequency shows as a smaller Blue peak (Octave 5), while the Third Partial shows as a Blue peak toward F#.
Note that when a string is first plucked, the attack generates a rich Spectrum Display, which settles quickly to the Fundamental and perhaps several Overtones, or Partials. The pattern of Overtones varies with the instrument, and is what our ears discern as tone, or timbre. The Spectrum Display of Fig 2 results from the relatively pure tone of a Tuning Fork.
Be Advised: Overdriving the input induces signal clipping, which generally causes the Spectrum Display to go Super Nova. Adjust input levels accordingly. Excessive Background noise can also be visible in the Spectrum Display.
3.0 Fundamental Indicator
Once the Spectrum Display stabilizes and before the Input decays, the Fundamental Indicator Tic Mark appears along the outside edge of the Spectrum Display. The location of the Tic Mark along the Note Dial indicates the Input Fundamental Note, and the color indicates the Octave.
4.0 Strobe Display
With the Two group pattern visible, rotation direction indicates Flat/Sharp and the rotation speed the tuning error. Final tuning is carried out by adjusting to stop the pattern rotation. Note that it doesn't matter the position of the pattern around the display, but only that the rotation is stopped, or at least as close as you can get it.
The Strobe Display works like this: The Input signal modulates the instantaneous brightness of successive sections of the Strobe Display as they are rotated around at twice the Reference Frequency of the Target Note. When the frequencies are synchronized a two group standing pattern appears. Slight mis-synchronization causes a shift in phase, and the Two Group pattern appears to rotate one way or the other. The greater the error, the faster they spin.
The strobe technique is highly sensitive, and response time to any changes of the Input is instantaneous. The PST is a true strobe Tuner. The Strobe Display is generated live, directly from the input signal waveform.
5.0 Filter Modes
Two Filter Modes are available through the Settings Pages.
[Bandpass] Filter Mode removes noise and harmonics to generate a clear Strobe Display. Recommended for most applications. Provides clean display during the note attack. It can also be used to measure separate Harmonics of a tone, so that the Inharmonicity of a piano string can be determined.
[All Pass] Filter Mode allows all harmonics to be seen:
The Fundamental as a two group
pattern, the Natural Fifth as a three group pattern and the Octave as a four group pattern, etc.
6.0 Calibration
The PST Calibration range is 60 Cents (1/100th of a Semitone) Flat or Sharp with .1 Cent resolution. To enable the Calibration Slider, Tap the [Calibrate] Button:
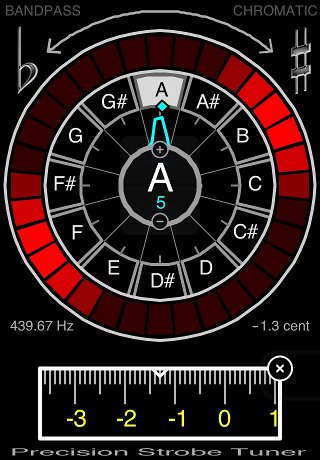
Fig 2
To calibrate to, or measure the error of an external Reference Pitch, apply Input and move the Calibration Slider to gently bring the Strobe Display rotation to a stop.
The Calibration Value is shown in the lower right of the Strobe Display Ring, and the current Target Note Reference Frequency is shown in the lower left.
Figure 2 shows the display calibrated to an A 440 tuning fork. At room temperature this fork measured 1.3 Cent Flat. Briefly warming it in my hands changed it to 2.0 Cent Flat. Letting it soak in the refrigerator changed it to 5.5 Cents Sharp.
7.0 Note Tracking Mode
Several Note Tracking Modes are available through the Settings Pages.
[CHROMATC] - Target Note Follows dominant Input Fundamental Note.
[GUITAR] - Provides more robust tracking for Standard Guitar.
[BASS] - Provides more robust tracking for Bass Guitar.
[OFF] - Manually Select Target Note.
8. Advanced Functions
8.1 Temperament Banks Overview
Temperament Mode is an advanced feature of the PST which provides multiple
Temperament Banks with separate Calibration
Settings for each of the 88 piano notes.
This can be useful for tuning in alternate
Temperaments, tuning Piano Stretch and
special Guitar Intonation systems. Five User Configurable Banks are provided, as well as several examples in Fixed Banks.
For Example, to use the Provided Typical Short Upright Piano Stretch Curve: Tap the [Settings] Button and Tap the [Next>] Button to navigate to Temperament Page. Then Tap the [>] Button in the upper right to select Fixed Bank 2. The Display should look like this:
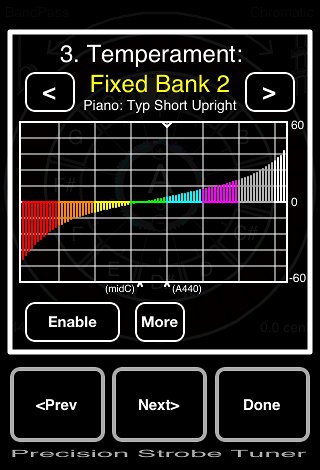
Fig 3
The Table in Fig 3 shows the Stretch Curve for a typical piano. Tap the [Enable] Button and it changes to Green to indicate that this Bank is activated. Next Tap the [Done] Button to return to the main Tuner Display:
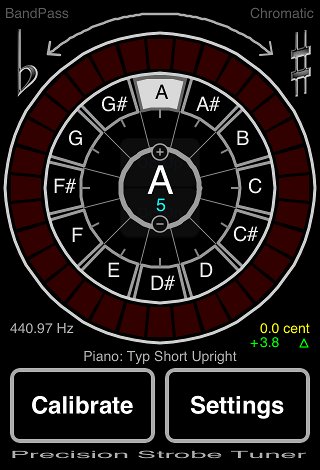
Fig 4
Notice that now, as well as the Master Calibration value, now shown in Yellow, there is an additional Calibration value shown in Green. This is the Calibration adjustment for the currently selected Note. Change the Note Setting and this will be updated to the corresponding value from the Table. The total Calibration adjustment is the sum of the two.
8.2 Temperament User Bank Configuration
The 5 User Banks can be custom configured. Start at the main Display Page and follow these steps to see how it is done:
- Tap [Settings] and use [Next>] to navigate to the Temperament Page.
- Tap the [<] / [>] Buttons to navigate to User Bank 1.
- Tap the [Enable Button], highlighting it in Green.
- Tap the [UnLock] Button, highlighting it in Red, to enable editing of the Bank.
- Tap [More] and [Clear] to clear the Bank if it is not.
- Tap [Done] to return to the main Display.
- Select Note C4,
- Tap [Calibrate].
Notice the Calibrate Slider is now Green, and sliding it Changes the Green setting. Adjust it to +2 Cents.
Dismiss the Calibrate Dial, and Tap [Settings] to return to the User Bank 1 Table, which should now look like Fig 5:
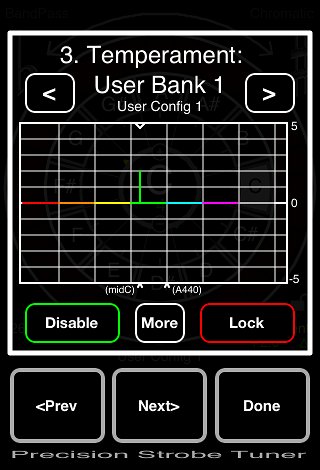
Fig 5
Repeat for each Note to setup the Bank as desired. When done, return to the Table Page and Tap [Lock] to disable editing of the Bank.
Note that when a Bank is Unlocked for editing, the Calibration Slider adjusts the Bank Note Value (Green), and when Locked, adjusts the Master Calibration Value (Yellow).
Banks can also be Copied from one to another. A fixed bank can be copied to a User Bank and Modified. Banks can also be cleared. Tap [More] to access these functions.
8.3 Piano Stretch Calculator Overview
The PST has a facility to generate a Piano Stretch curve from a set of string inharmonicity measurement inputs. The bandpass filter is used to measure and input the Fundamental and Second Partial of a string separately. The difference is the Inharmonicity. There are several Special Banks for Piano String Inharmonicity measurements and Piano Stretch Curve calculation. From the Temperament Page, Tap [<] to navigate to the Temperament Measurement Table Page:
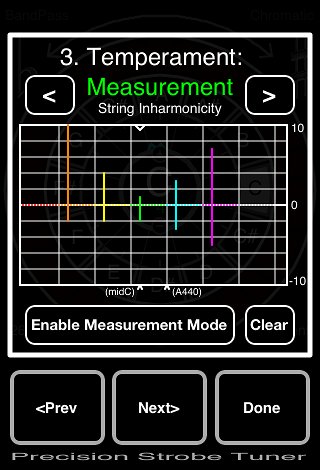
Fig 6
Fig 6 shows a set of representative Inhamonicity measurements of several strings across the keyboard. This is the Example data set given below. The bottom of the bars are the Fundamental Measurement, the top is the 2nd Partial Measurement. Bar Length is Inharmonicity. Tap [<] to navigate to the Temperament Data Fit Page:
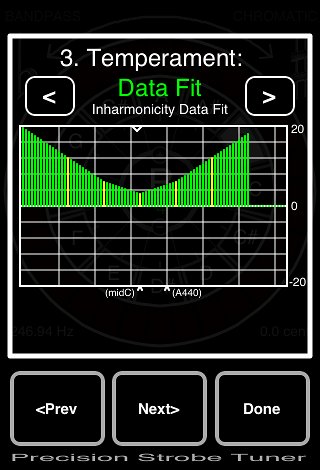
Fig 7
Fig 7 shows the results of a fit of the input data to fill all notes. The yellow bars are input data, while the green bars are the fit data. Any number of strings can be set to input, gaps are filled with fit data. Tap [<] again to navigate to the Temperament Result Page:
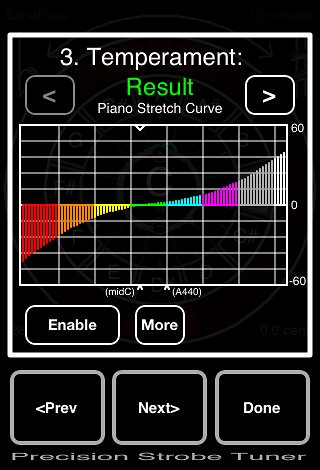
Fig 8
Fig 8 shows the calculated Stretch Curve Table resulting from accumulating the fit data across the keyboard. To copy to one of the User Banks, Tap [More] and [Copy].
8.4 Inharmonicity Measurement and Data Entry
String Inharmonicity can be measured directly by first measuring the Fundamental. Then measuring the 2nd Partial of the same string by setting the Note Setting one Octave higher with the BandPass Filter enabled. Inharmonicity of the particular String is the difference between the two. With Inharmonicity Measurement Mode Active, these measurements are integrated with Data Table entry.
Begin this Example by navigating to the Temperament Measurement String Inharmonicity Page (Fig 6) and Tap [Enable Measurement Mode]. The [Clear] will zero all of the data to begin. Tap [Done] to return to the main display and select the note C5. The screen should now look like this:
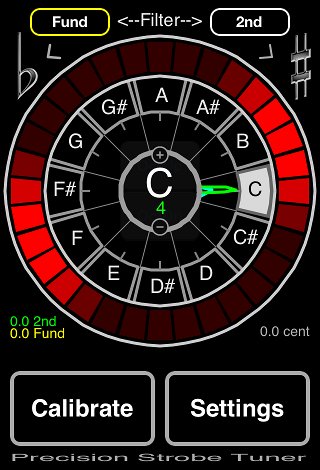
Fig 9
Notice two additional buttons at the Top: [Fund] and [2nd]. These select the BandPass filter and input mode.
With [Fund] selected, Tap [Calibrate] to enable the Slider.
When a string is sounded, the Fundamental will show in the Strobe Display as the usual two group pattern. Adjust the Calibration to stop rotation. Note that the Fund value, shown in Yellow, is adjusted. For purposes of this Example, adjust the Calibration value to -2.0.
Next, Tap [2nd] to change filter and entry mode:
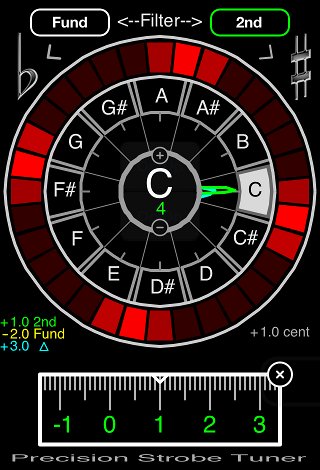
Fig 10
The BandPass filter is now set to pass only the 2nd Partial. Which, when a string is sounded, appears in the Strobe Display as a four Group pattern, as in Fig 10.
The Overtones of a piano string tend to ring a wee bit sharp compared to the Fundamental. This is due to the Overtones ringing on a subsection of the overall string, this subsection being effectively slightly stiffer. This phenomena is more pronounced on shorter or thicker strings, and increases towards the ends of a piano.
For purposes of the Example, next adjust the 2nd (Green) Calibration setting to 1.0 . The difference between the two, the Inharmonicity, is shown in Blue. The display should appear as in Fig 10. Return to the Temperament Measurement Table Page to verify that this data point has been entered.
To Complete this Example, repeat these steps to enter the following data into the Table:
C2 Fund= -2.0 2nd= +10.0
C3 Fund= -2.0 2nd= +4.0
C4 Fund= -2.0 2nd= +1.0
C5 Fund= -3.0 2nd= +3.0
C6 Fund= -3.0 2nd= +7.0
The Temperament Measurement Data Page should now look like Fig 6.
You can now modify the levels of Inharmonicity at different points and experiment with how the resulting Stretch Curve is affected.
Tip: To quickly reset and null a measurement point, Double Tap [Fund].
8.5 Piano Stretch Curve Calculation Notes
By careful selection of a few representative measurement points, a reasonable smooth fit Piano Stretch Curve can be generated. Any number of measurements can be used, From A1 up to C7. If only a few measurement points are entered, the data is interpolated between them, and extrapolated out to the ends.
Generally, start at A440 or middle C and set one or more representative measurements up and down at octave intervals or so.
Tip: A zero point in the Inharmonicity Fit Table can be forced by setting the Fund and 2nd settings to the same non-zero value.
The Piano Stretch Curve is generated by adjusting each octave such that the fundamental of the upper matches the 2nd harmonic of the lower. This method is described in "Piano Servicing Tuning & Rebuilding" by Arthur Reblitz.
9. General Piano Tuning Notes
Tuning the Lower Octave of a piano can be problematic, as the internal microphone low frequency roll-off of many devices starts at about 150 Hz. An external mic with good low frequency response is recommended.
Further, the harmonic levels of strings in this range are generally much greater than the fundamental, so can be difficult to filter. These strings are probably better handled by directly tuning their 2nd Harmonic to the Fundamental of the string one octave higher.
The End
Further Reading:
Piano Servicing Tuning & Rebuilding
Arthur A. Reblitz (1993), The Vestal Press
PIANO TUNING, A Simple and Accurate Method for Amateurs
J. Cree Fischer (1907)
The Equal Tempered Scale and Some Peculiarities of Piano Tuning
The Endangered
Paino Technician (Essay, James Boyk)
[PST Home]